How much does a journal weight? A commentary on MDPI’s own study on their self-citations rates
A recent blog published by the Association of Learned and Professional Society Publishers, written by MDPI staff Dr. Giulia Stefenelli and Dr. Enric Sayas, explored MDPI and other publishers self-citations in 2024. In line with MDPI usual transparency, they kindly included the data they used, along with the relevant code in Python.
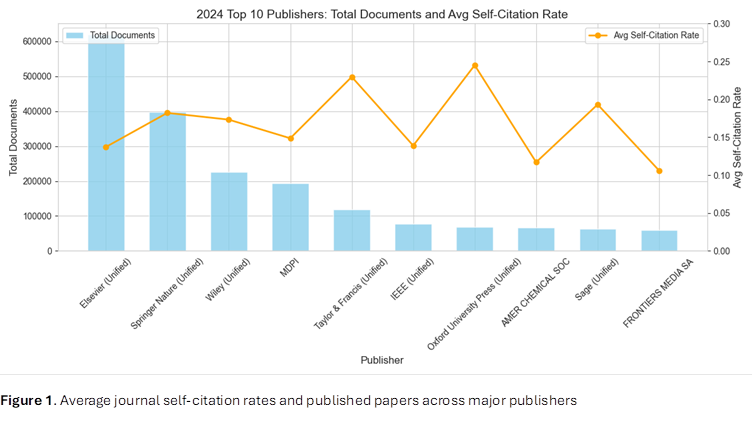
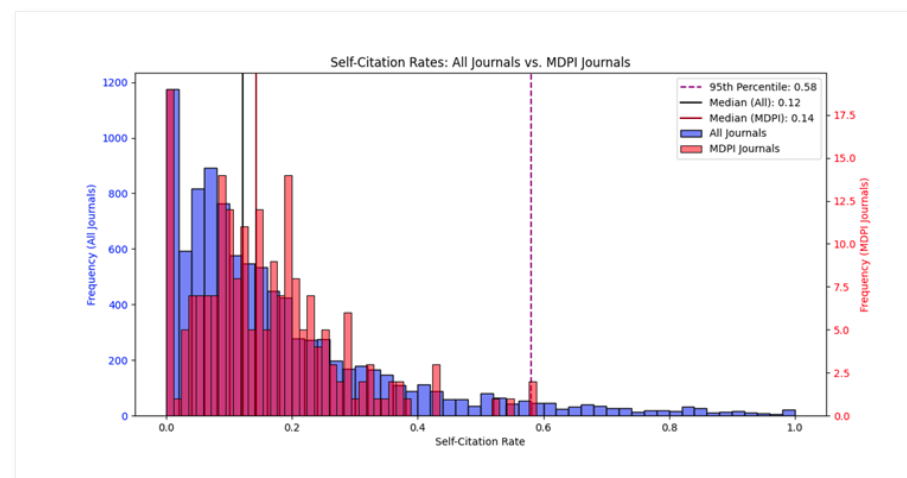
Figure 1 in their blog instantly caught my attention, and my commentary on their blog is mainly around this figure and its interpretation.
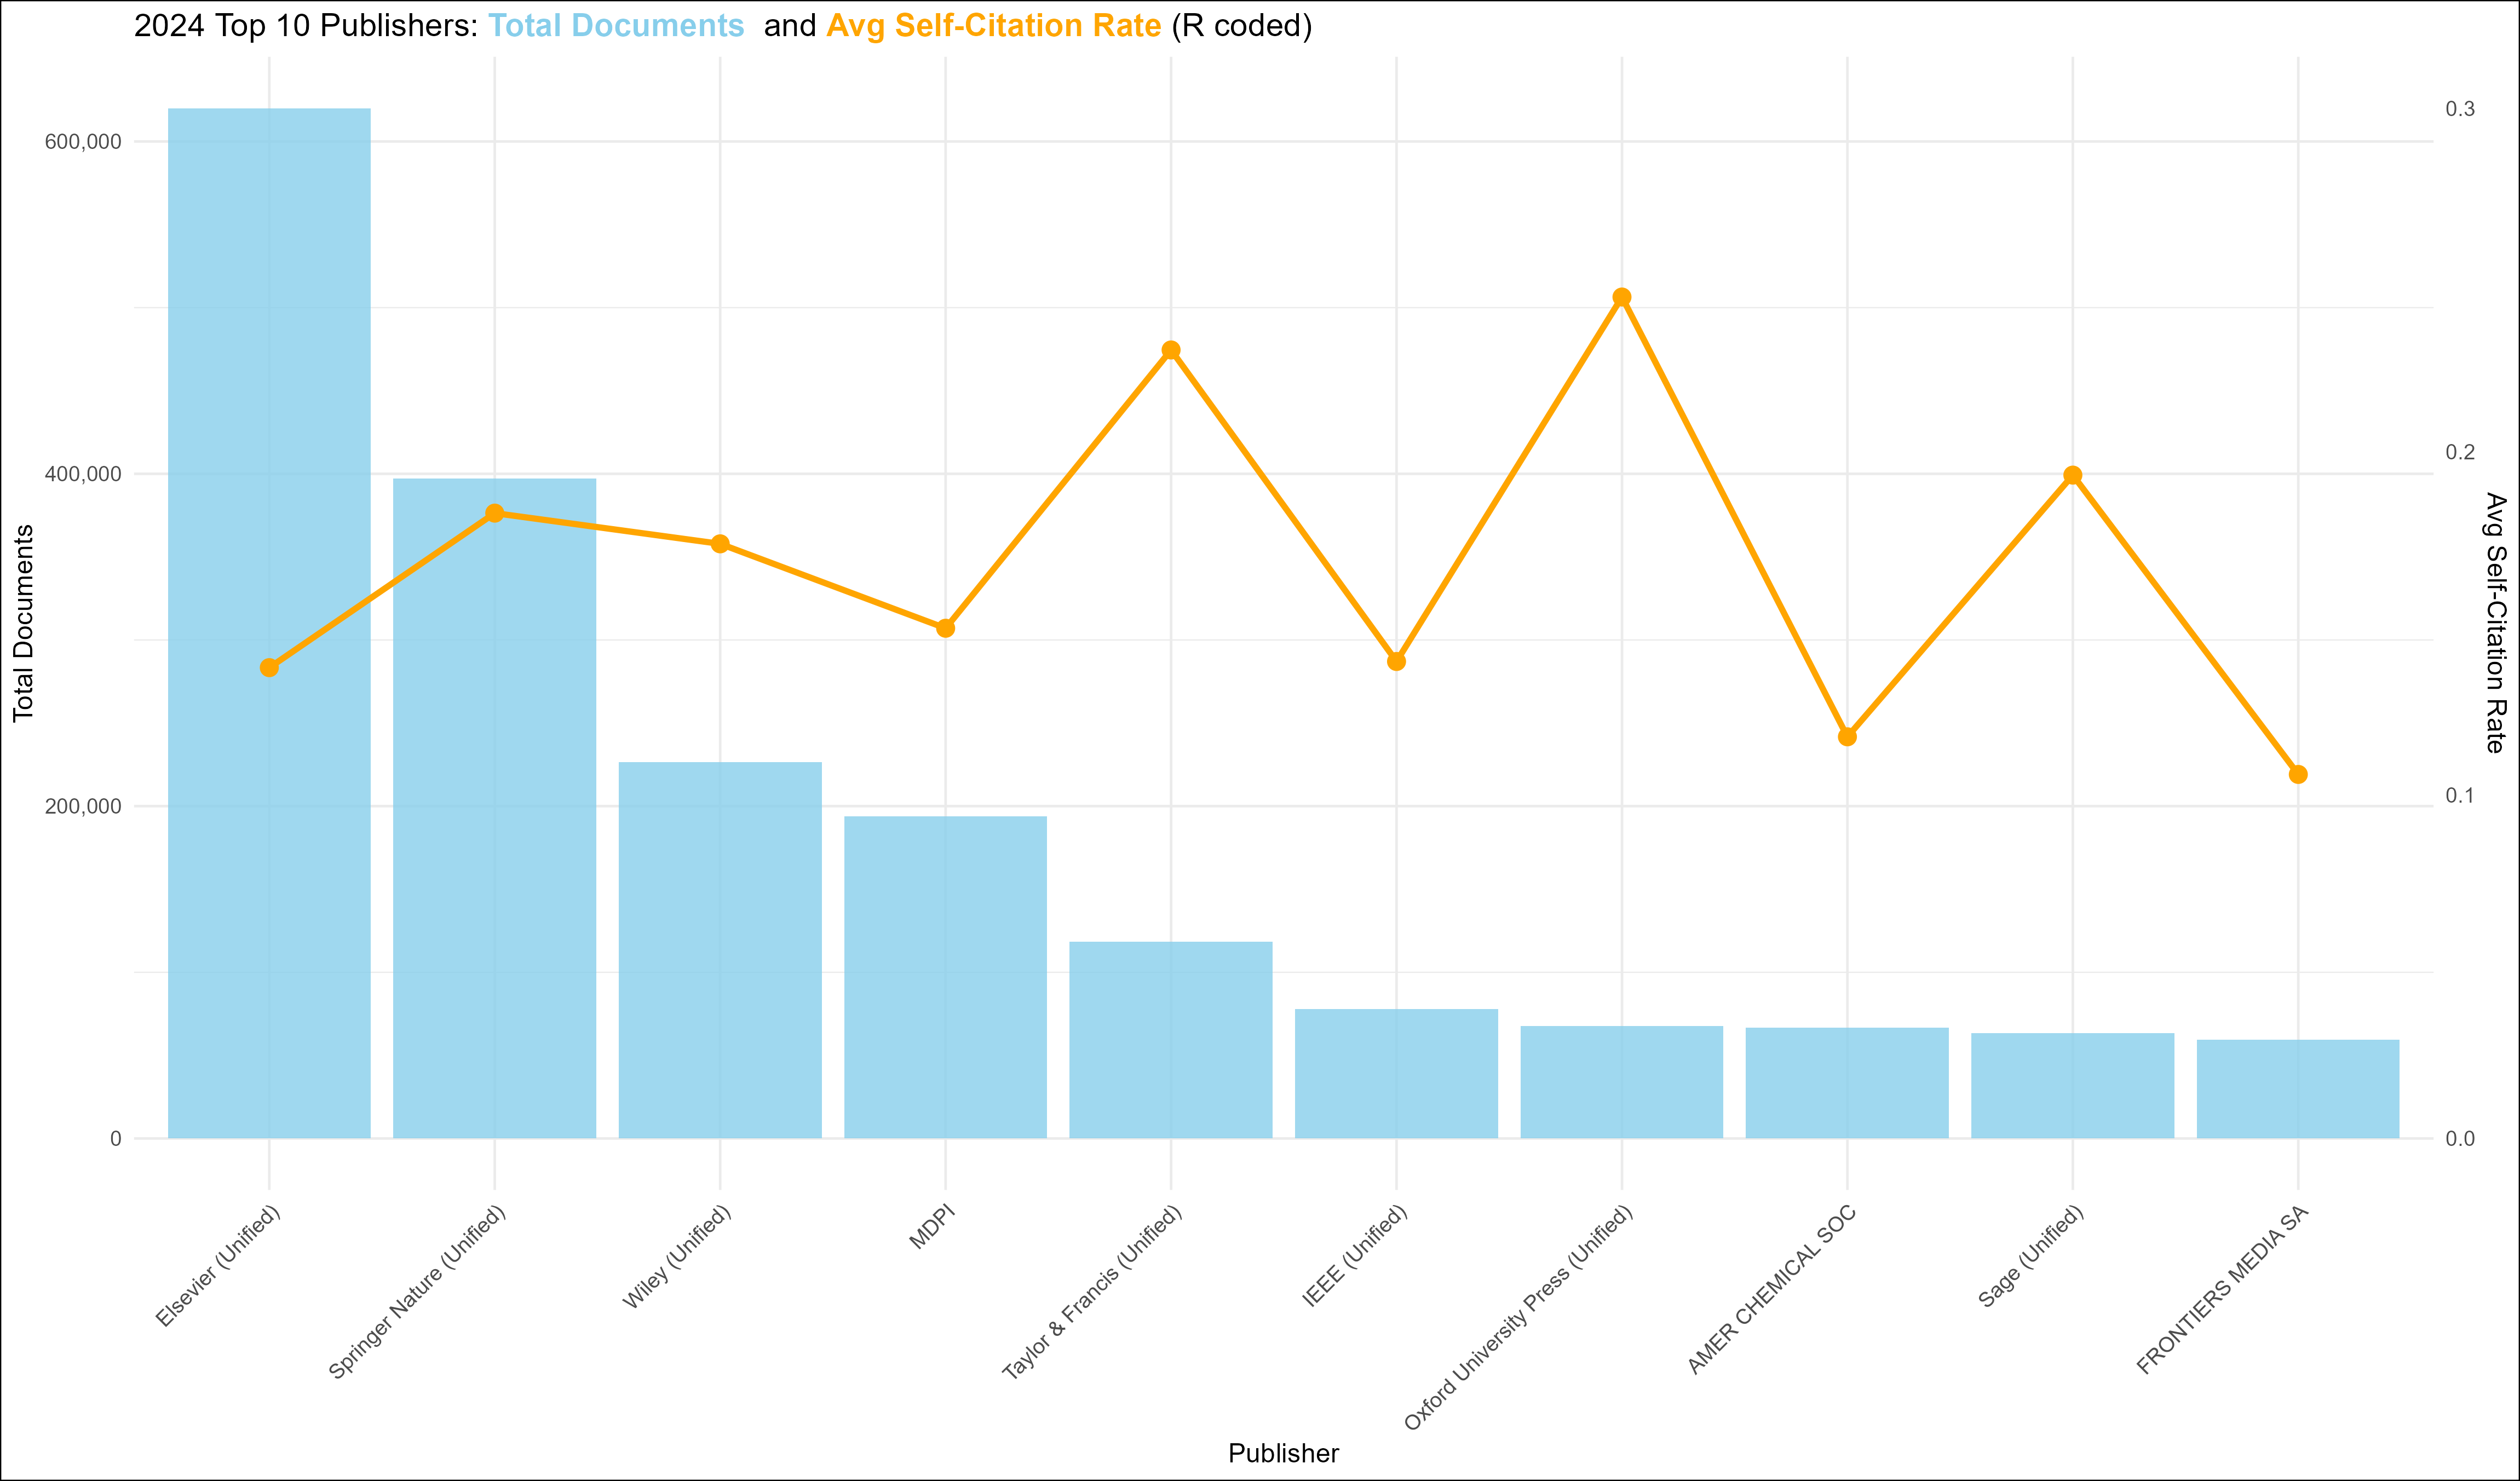
Figure 1 is easily reproducible thanks to the provided (and well-documented) script, top_10.py. Now, I can do a little bit of Python, but I’m less likely to make mistakes in my native language: R. I’ve teamed up with chatGPT to translate top_10.py into top_10_PGB.R, and the code necessary to replicate this commentary is available here: [Github link]. The conversion outputs same data as their Table 1 and similar graph (I took the liberty of some aesthetic changes):
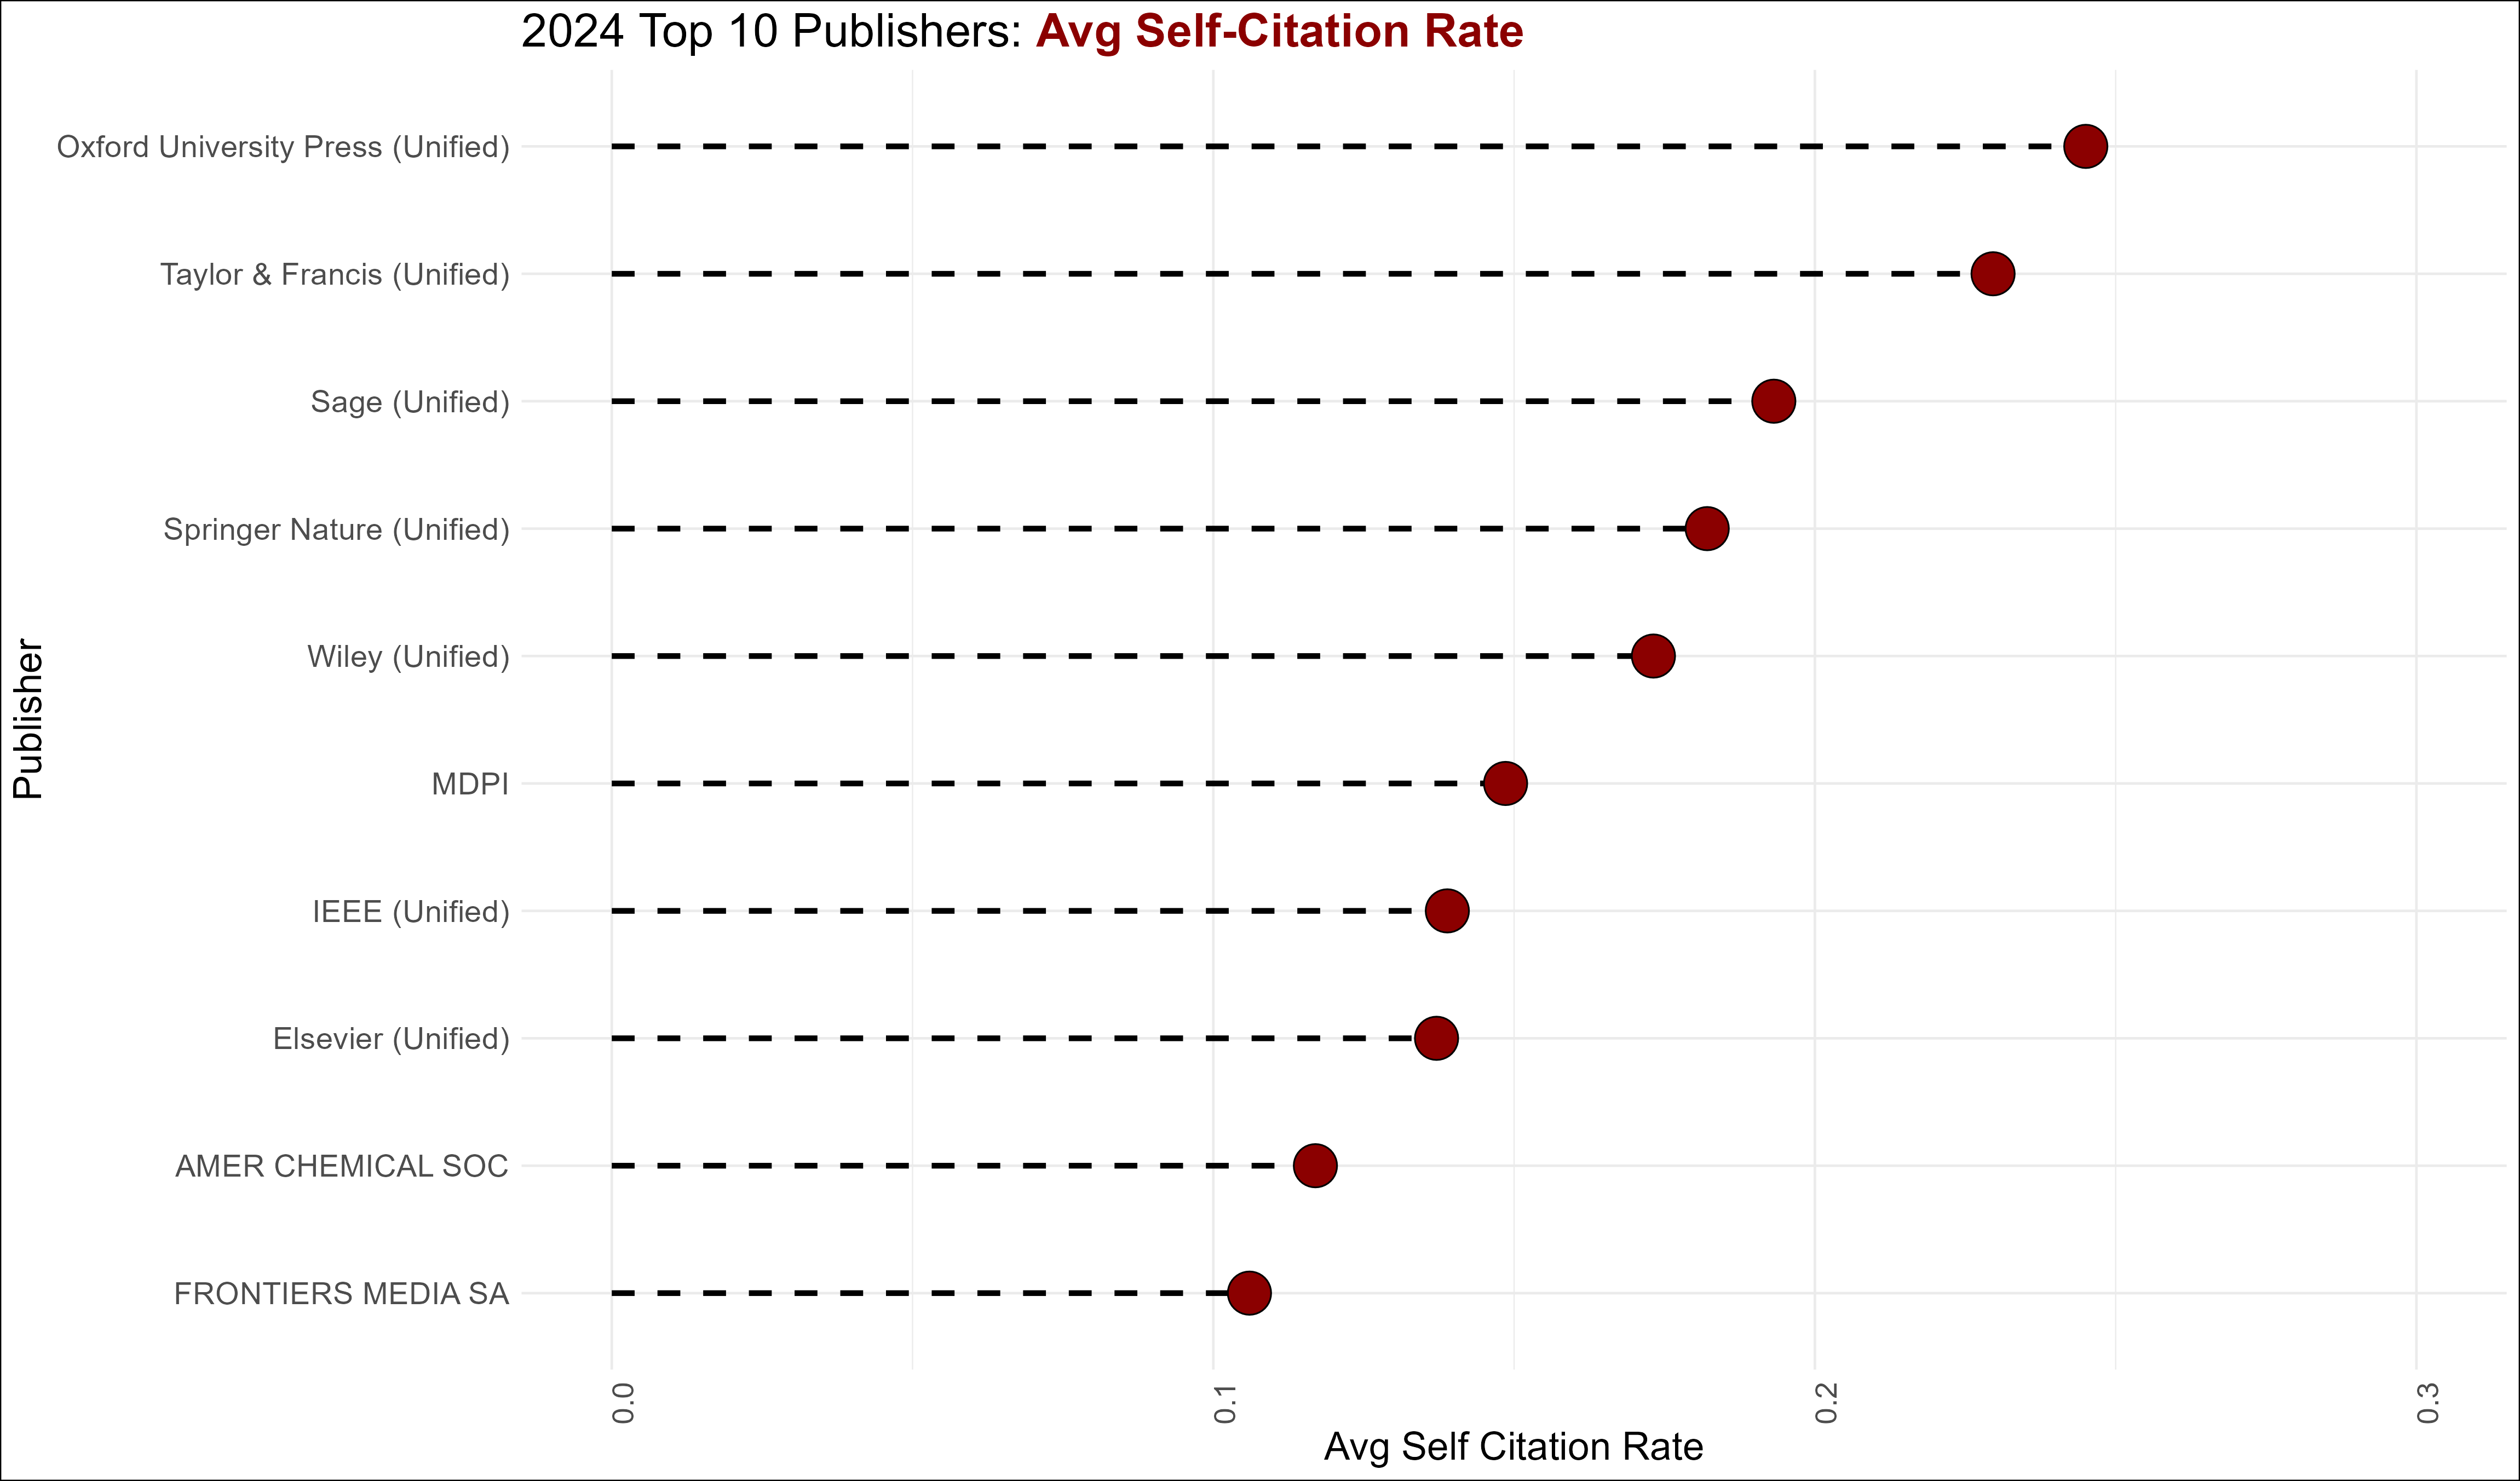
Having Total Documents in this graph was masking the information conveyed by Average Self-citation rates. Here is the data for Average self citation rates with publishers rearranged by it.
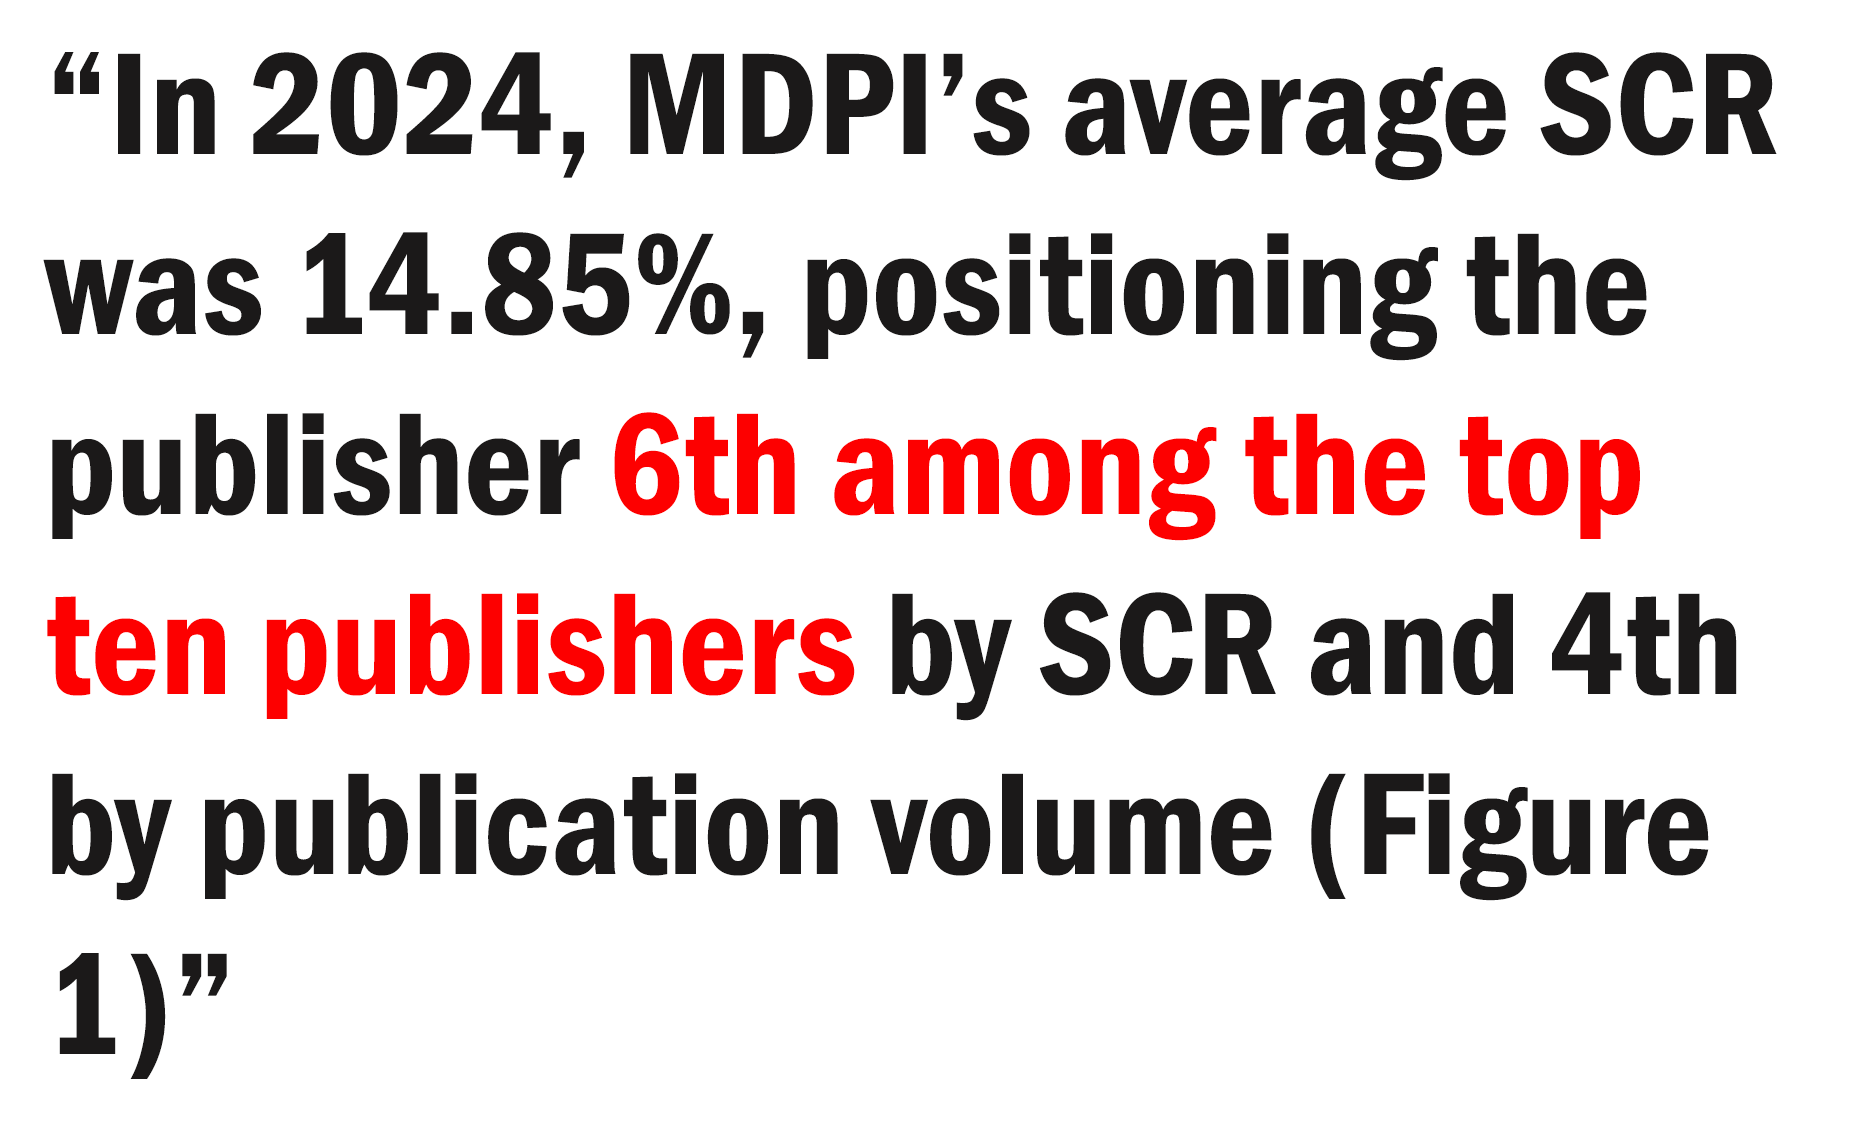
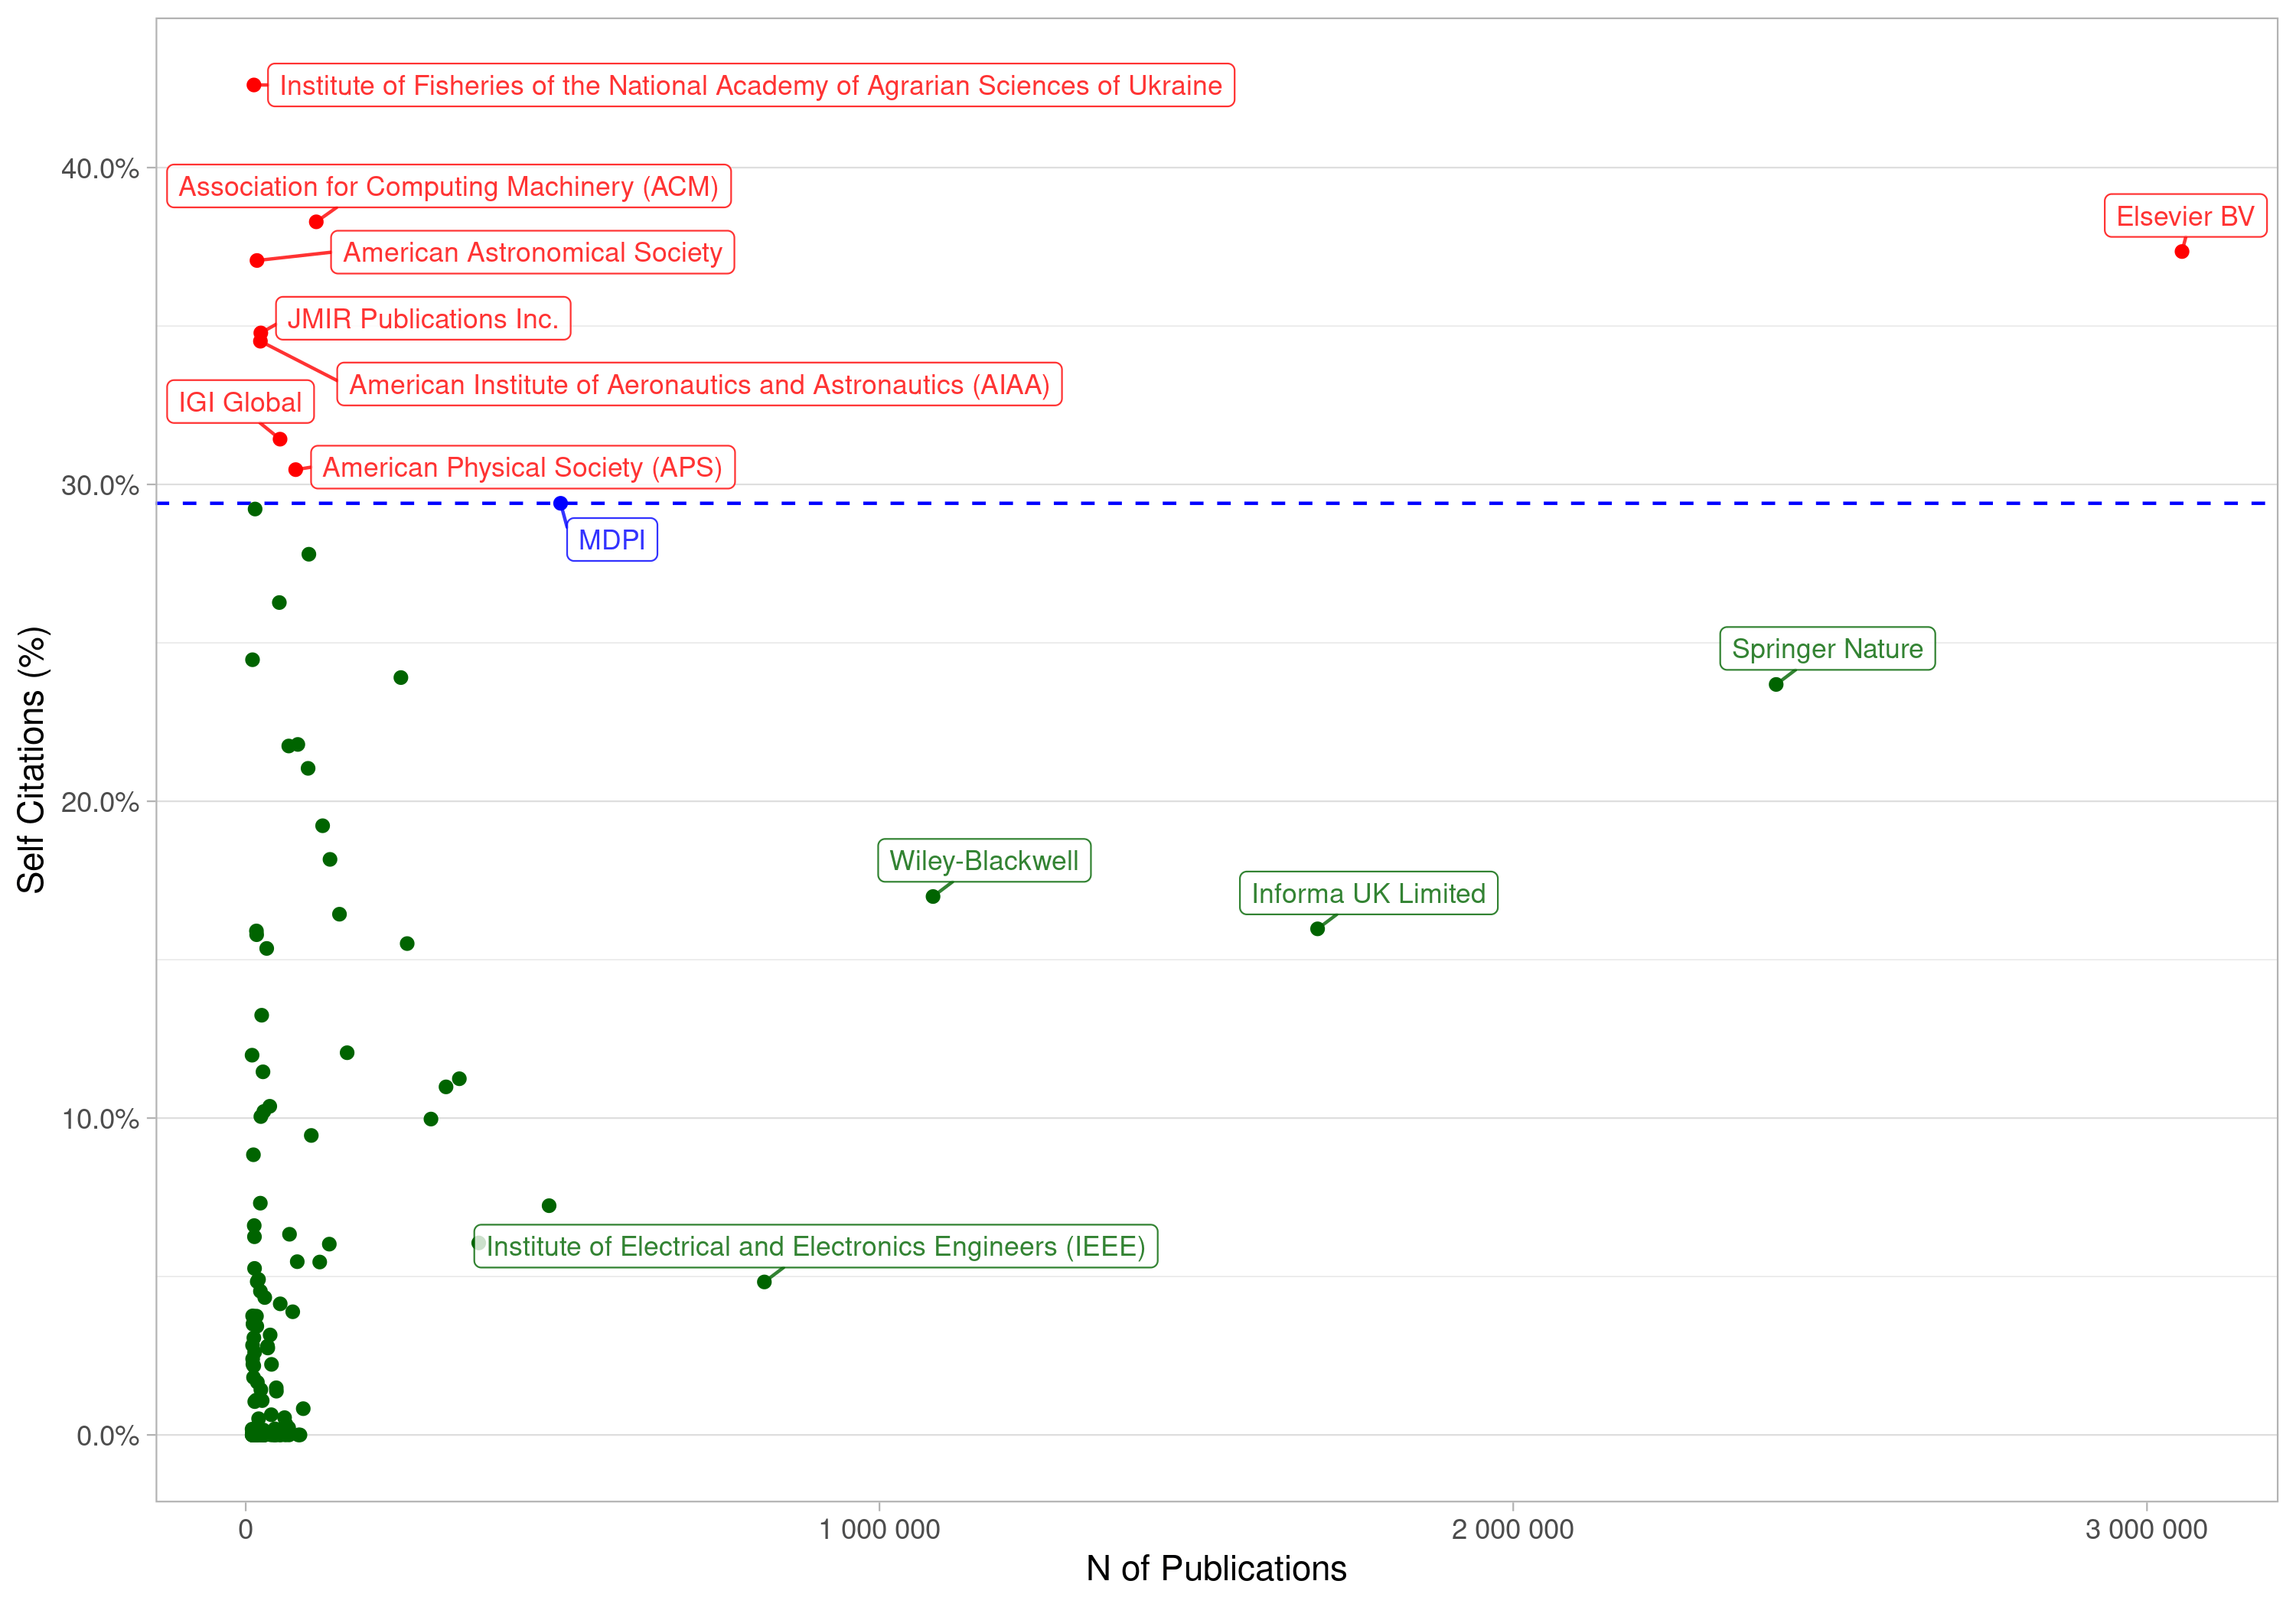
As discussed on the blog, MDPI ranks 6th in self-citation among the largest publishers. However, there is a major issue with how this data has been analyzed: the average self-citation rate was calculated by simply averaging each journal’s self-citation rate without accounting for the total number of publications per journal. In other words, every journal contributed equally to the average, regardless of its size.
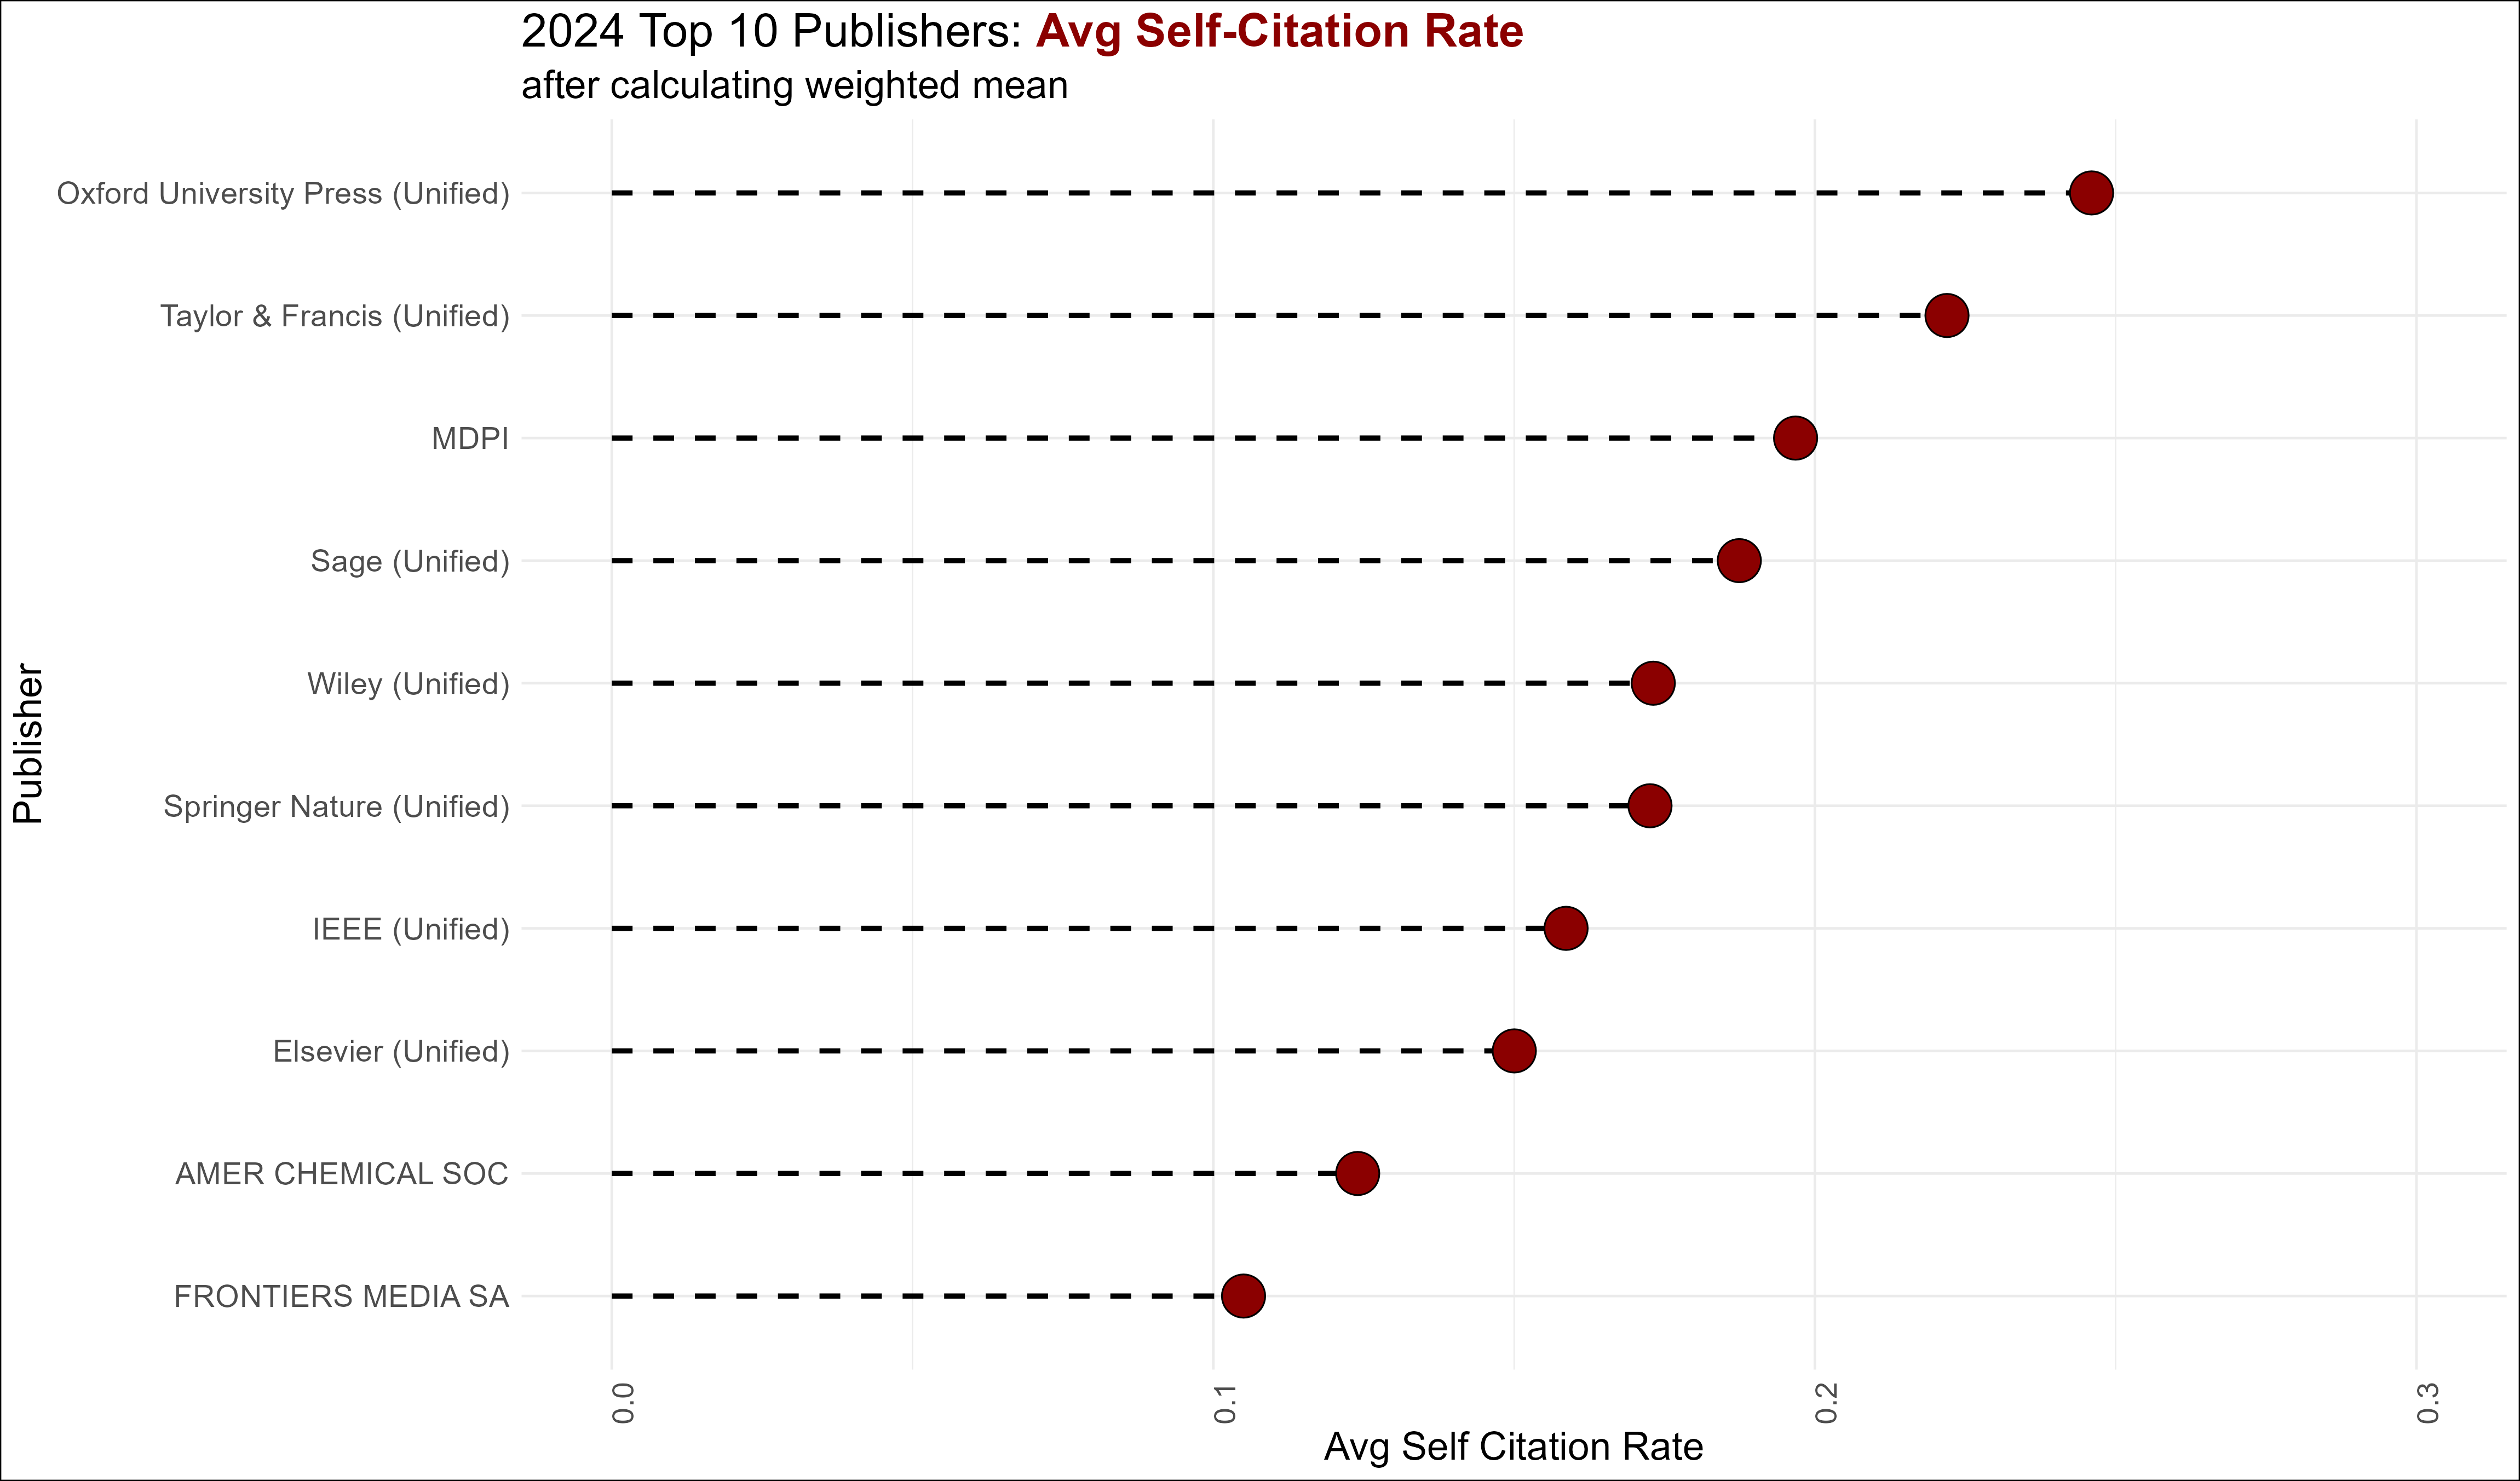
Here, I present the results of the analysis when the means are weighted by the total number of documents published per journal in 2024:
Additionally, here is a summary table comparing self-citation rates before and after considering weighted means.
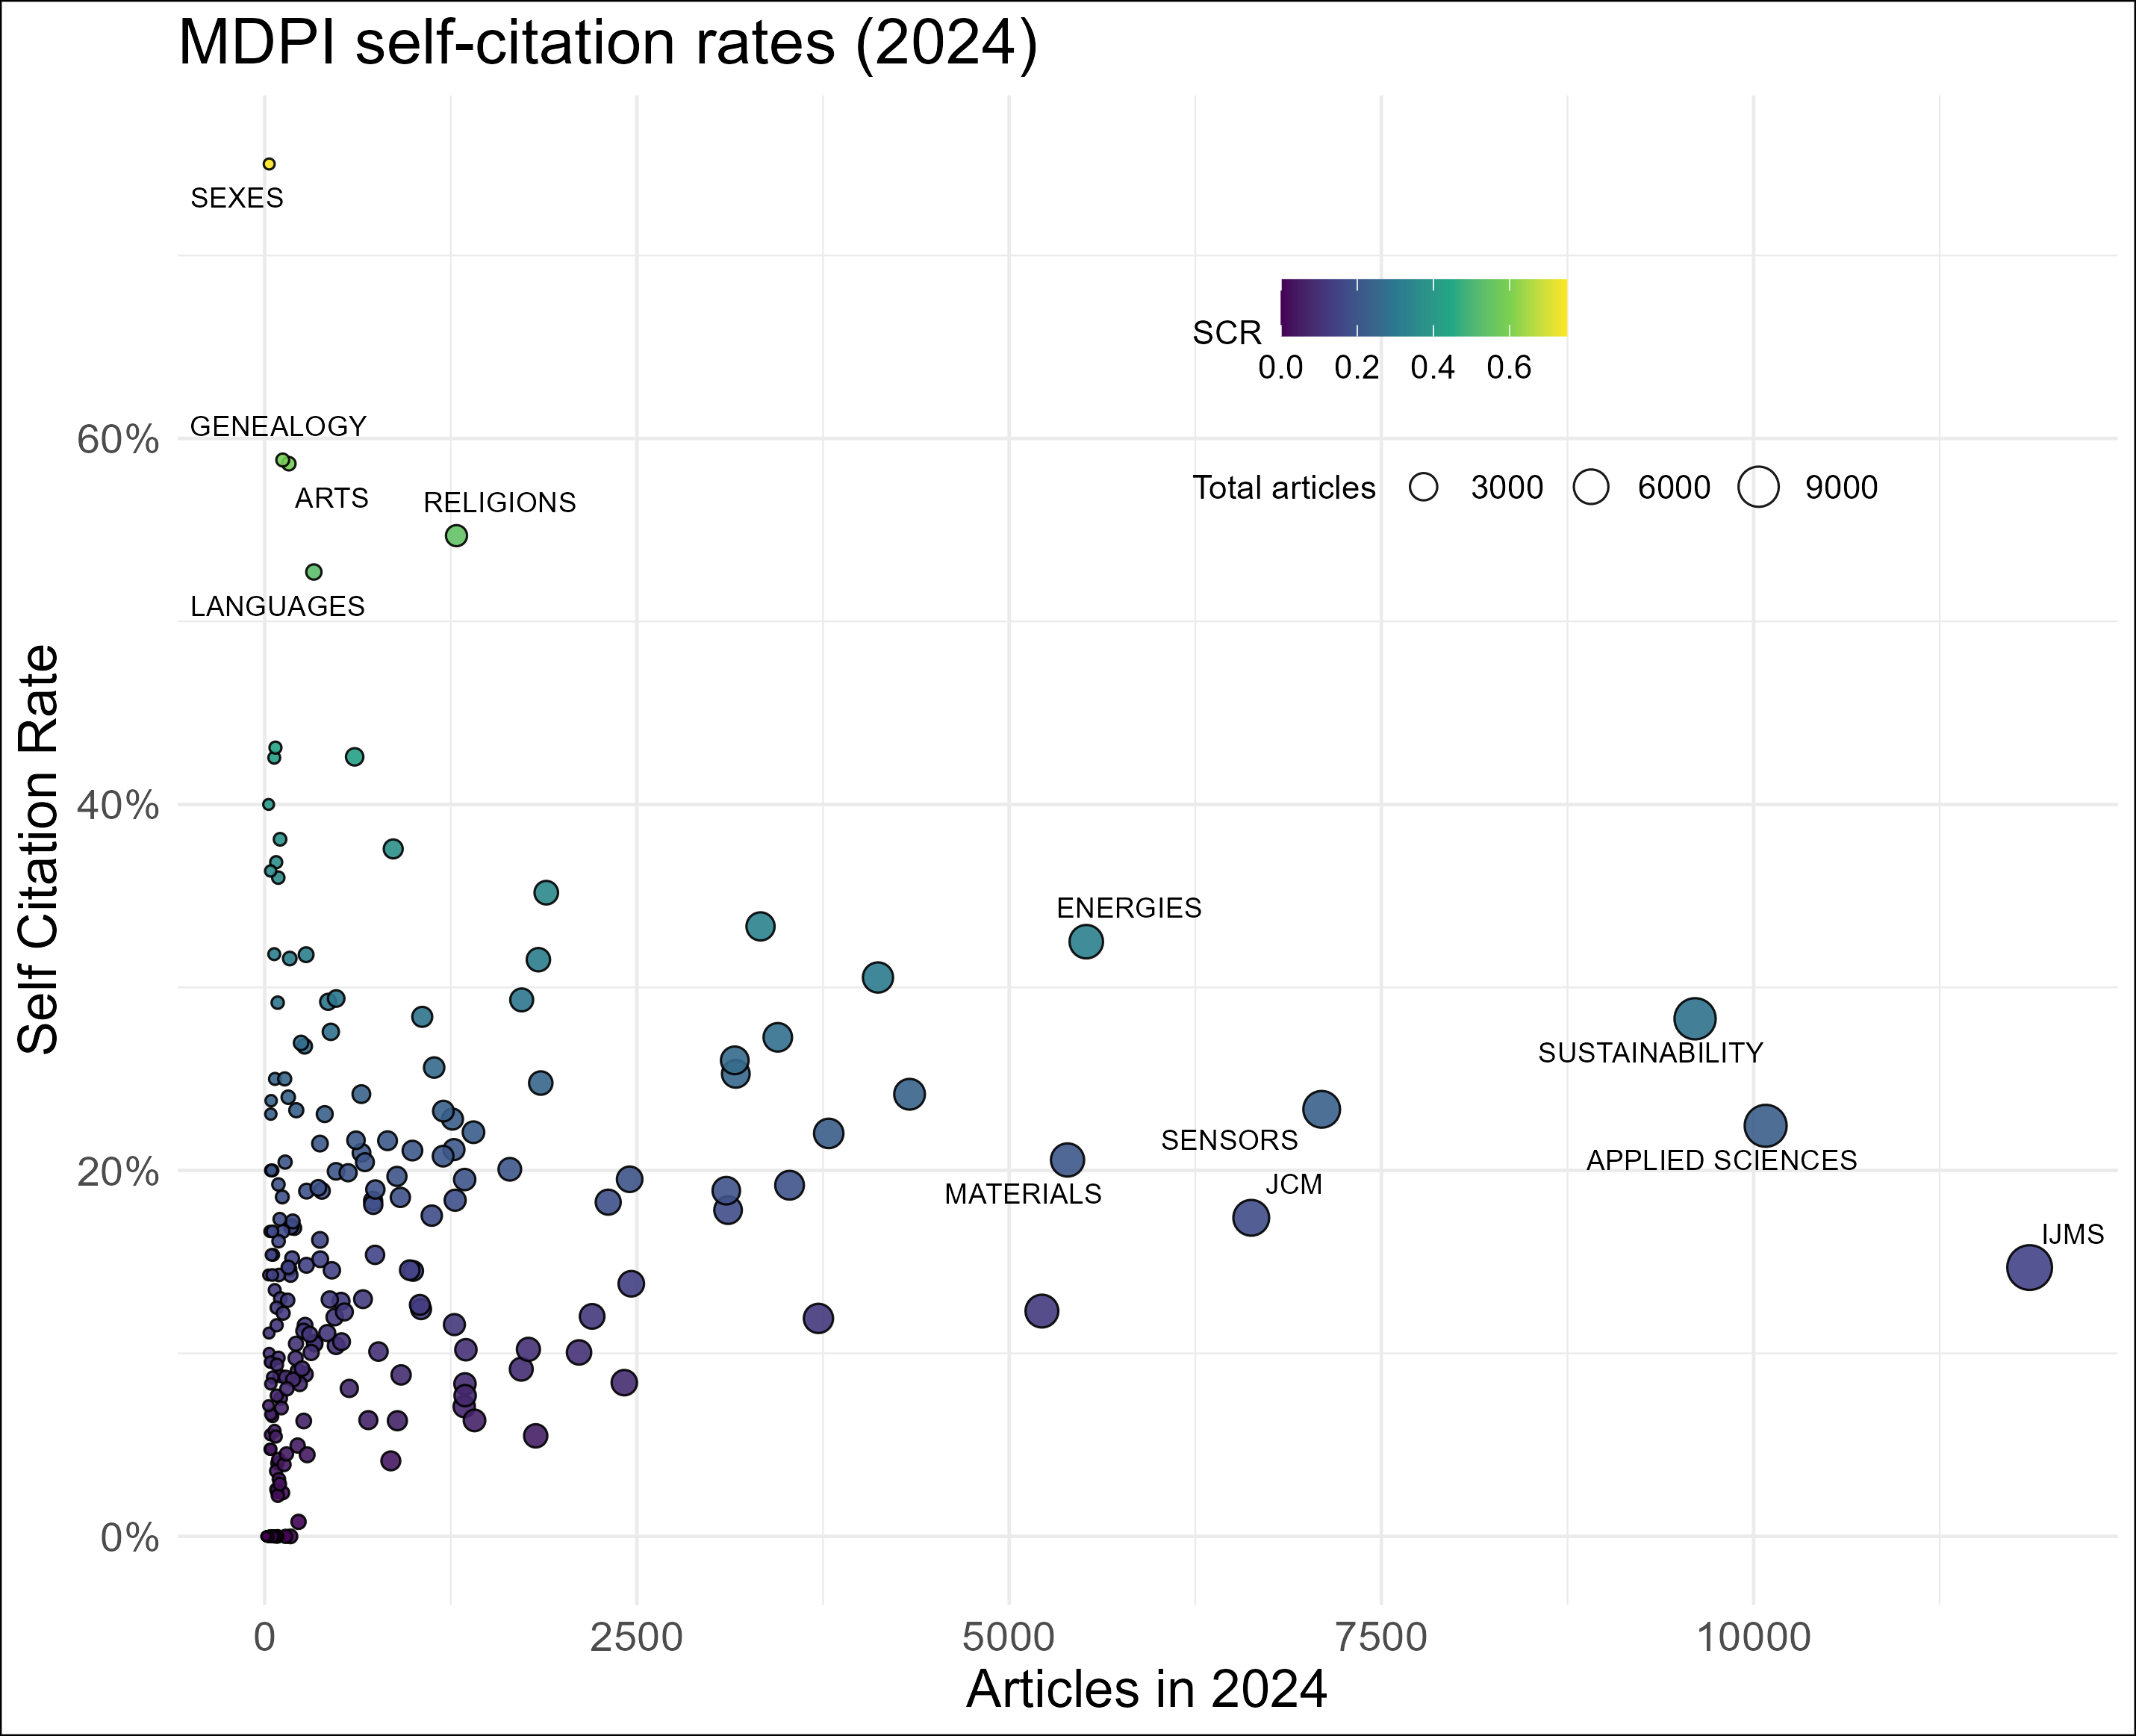
Overall, MDPI is the most affected publisher after applying weighted means. The reanalysis of the data using weighted means moves MDPI from 6th position (with a 14% self-citation rate) to 3rd position (with a 19.7% self-citation rate). Notably, the previous table leaders, OUP and T&F, remain in their respective positions with little change in their final percentages, likely due to the balance of total documents across their journals. This contrasts with the higher threshold of total documents per journal in MDPI, possibly driven by larger journals having higher levels of self citation than smaller ones. Lets find out:
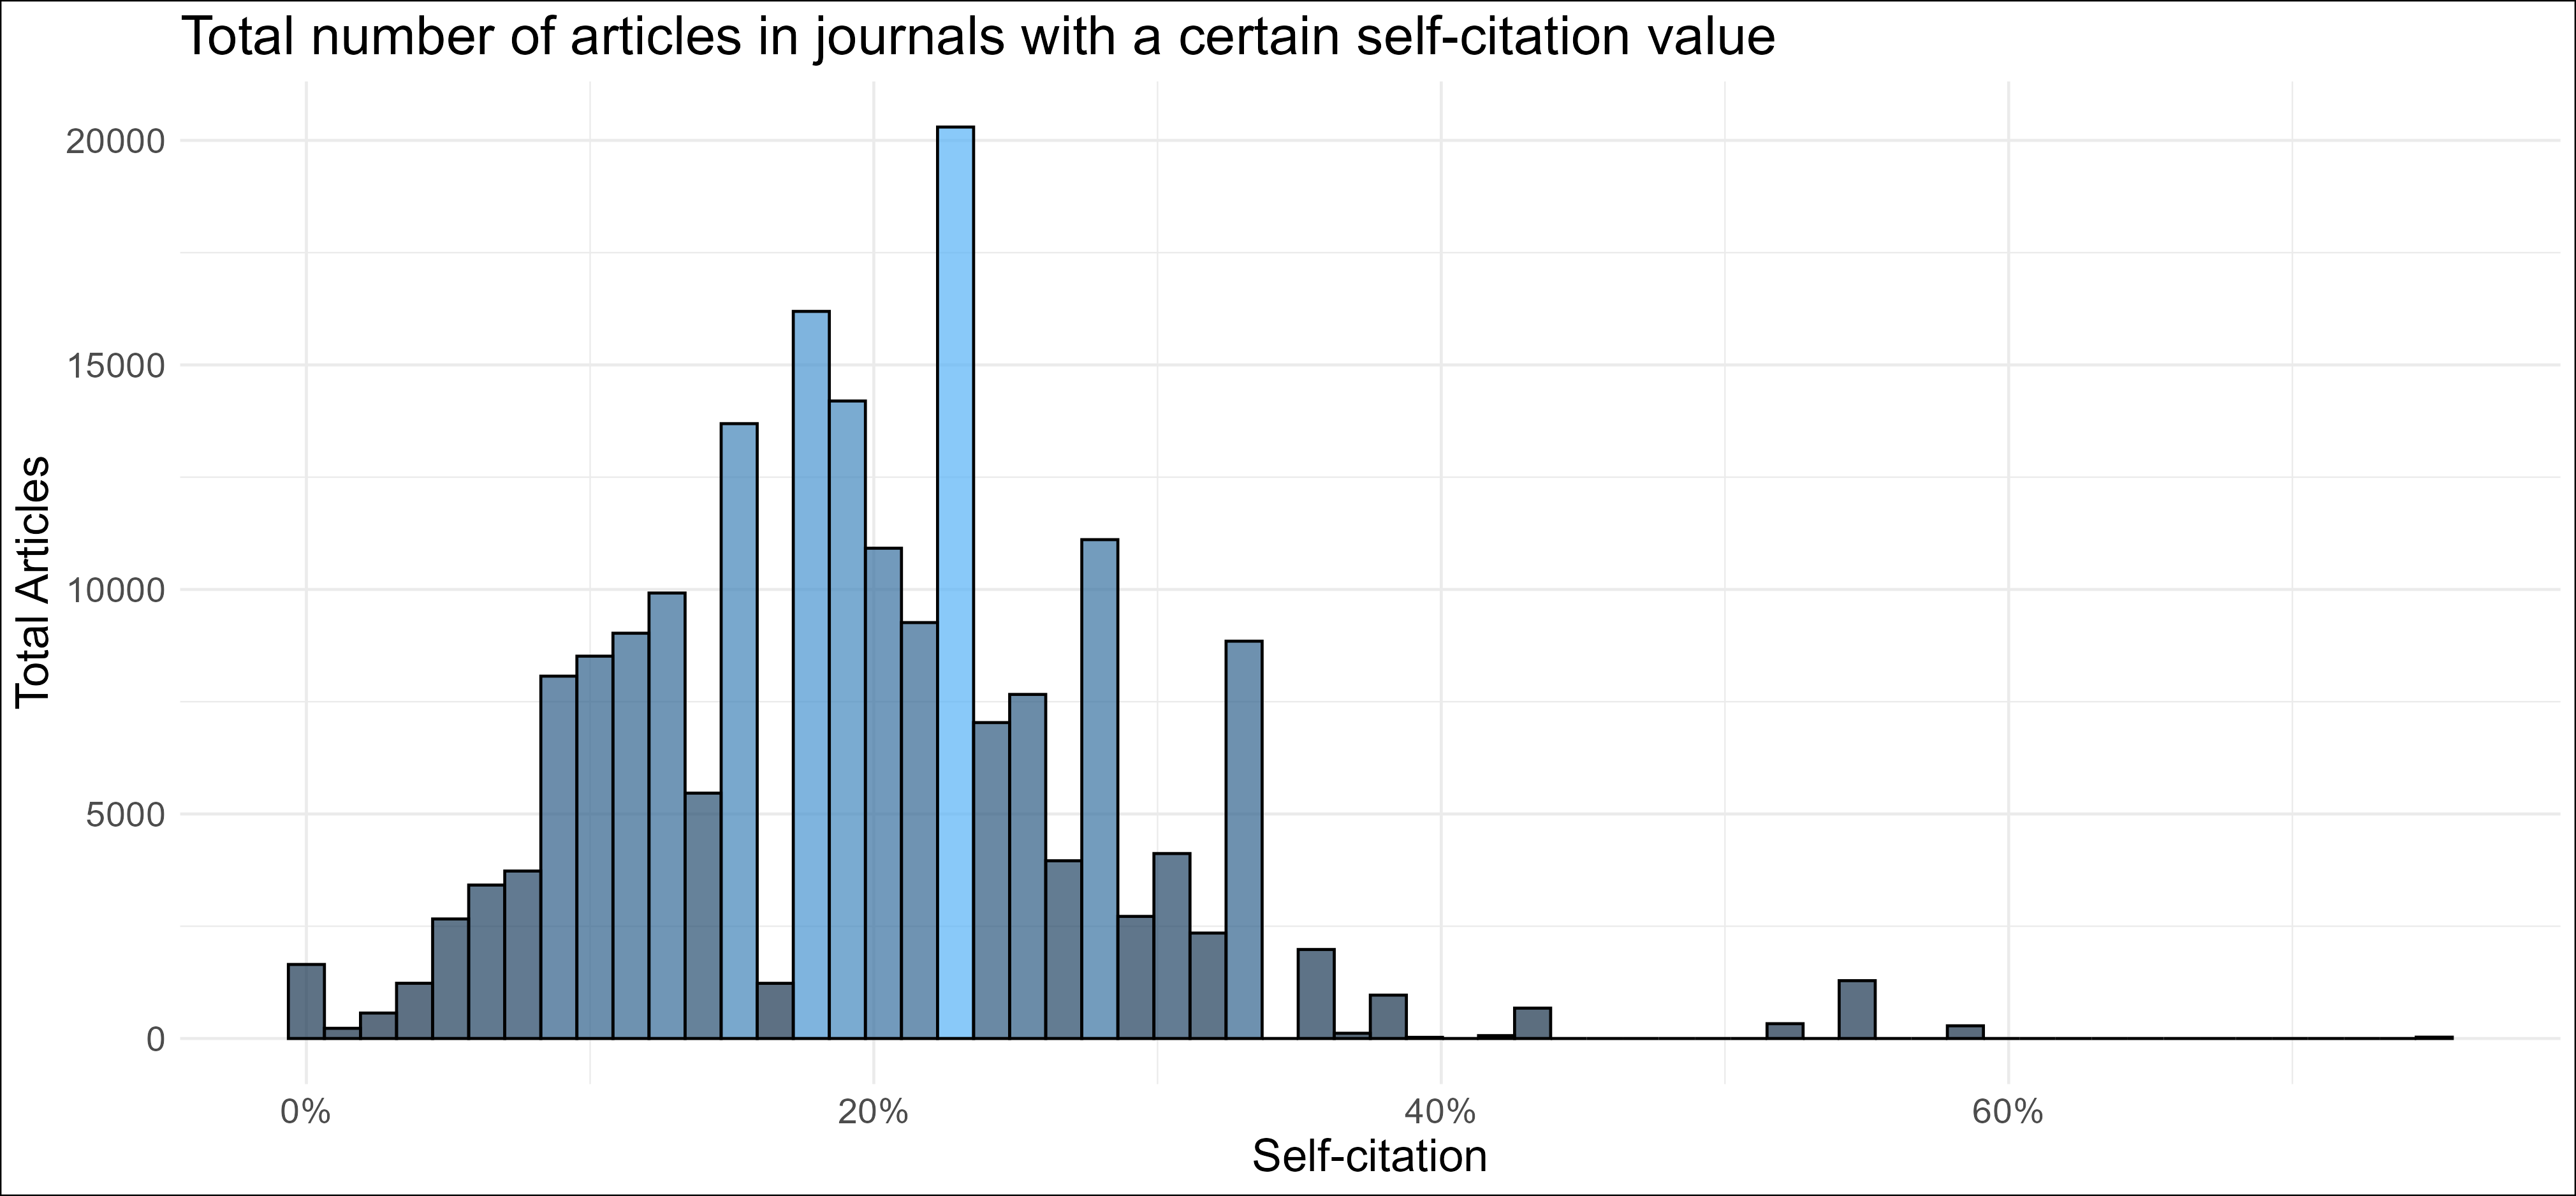
The data shows that, out of the 237 selected journals, 57 have a self-citation rate over 20%, although only 25 have more than 1,000 articles published in 2024. MDPI published 193,873 articles, of which 47% where published in journals with a self-citation rate over 20%. This % decreases down to 10.8% for number of articles published in journals with self-cite rates over 30%. Assigning each article the journal’s self-citation rate provides an alternative perspective on MDPI’s decision to plot journal frequency by average self-citation rate.
Weighted means present a different perspective on the 2024 self-citation landscape, making it important to analyze them in a multi-publisher context. However, conclusions drawn from both the original and reinterpreted graphs still come with significant caveats:
The time window is limited to 2024. Temporal context is crucial, especially for understanding shifts in self-citation trends in modern publishing. A previous MDPI self-assessment on self-citations, covering the period from 2018 to 2021, showed self-citation rates close to 30%.
Publishers have different balances of natural sciences and humanities in their coverage, and each discipline may exhibit varying self-citation rates.
In conclusion, analyzing self-citation at the publisher level requires the use of weighted data to be truly effective, especially to avoid biases introduced by the disparity in journal sizes. I encourage MDPI (and other publishers) to try this approach in further self-analysis of their practices.

