Announcement: “The Strain on Scientific Publishing” data explorer!
A common sentiment we have received is that it is a shame we cannot release our data. We think so too. But the legal advice about how to treat web-scraped data is clear: we cannot share the raw data1.
But… After many consultations, we’ve figured out exactly what data we can share, and so we’re doing just that. We’ve provided the first of some step-by-step guides for you to download the raw data for yourself (complete with screenshots!), and R code to assemble Scimago yearly data into a single dataframe. Take a look here
But if that sounds like a lot of work, we’re building an R-based shiny app that lets you type in your journal or publisher of interest and get reports on strain added by each publisher, proportion of special issue articles, average turnaround times per journal, and impact inflation!
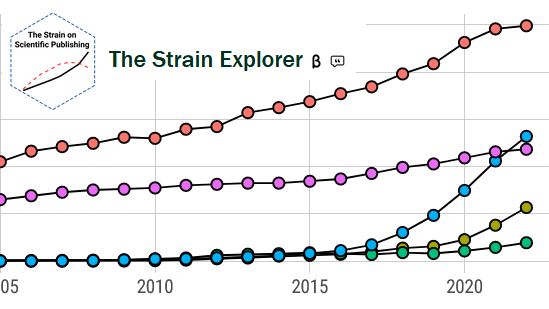
We were planning to share this during our revisions, but we’ve decided to release a sneak peek: we now have a beta version of this “Strain data explorer” on our website. As this app is in beta, we expect a few bugs. We’ve also got some data visualization ideas to develop, and some kinks to fix. We’ll be making improvements over time, so do check back for updates, and do send in improvements and suggestions on what you’d like to see it show!
Cheers,
Pablo Gómez Barreiro, Mark A. Hanson, Paolo Crosetto, and Dan Brockington
For those interested in accessing raw data, here are technical notes and instructions on how you can assemble those data for yourself.
Scripts
In the file Shiny_scripts_data_release.zip there is a folder setup in an R package format. Download this .zip file from Github, unzip the file, and open the Rproject and the main analysis script. The “Scripts” folder does not need to be touched. But you will need to follow the instructions below to populate the folders with the data needed for running the analysis.
Data related to Figures 1 & 5
These data come from Scimago, OECD, and UNESCO. This .pdf contains step-by-step instructions on how to assemble these data for yourself.
Data related to Figures 2, 3, and 4
Unfortunately, these data we simply cannot share. If publishers authorize us to release the data we have on them, we could. But until then, we have to keep these data private.
Still, we can explain how we collected these data, and if you’re coding-savvy, you can follow along. Pablo has been writing blog posts [1, 2, 3] on how he scraped different publishers, so stay tuned for updates. The current posts already guide you through the process for example publishers. In brief: we had to take a unique strategy to scraping each publisher, based on how they built their web HTML code. This is why our study is more limited in which publishers we analyse in Figures 2, 3, and 4. But the idea is generally the same for each publisher:
- Feed the script a list of DOIs/addresses
- Search the web page for lines in the html that contain the data of interest.
- For instance, the line below can be gives the date the article was put online: “meta name=”citation_online_date” content=”2018/01/23””
- Customize the script for each data point you want to collect, for each publisher, sometimes in subgroup-specific ways…
- Check your data very very carefully for errors. Web pages can themselves contain errors even if your script is good! For example, we got quite a few articles published online Jan 1st 1970 (the so-called “epoch date”).
A technical note on Impact Inflation
In the preprint we used a 2-year window for Clarivate Impact Factor or Scopus cites/doc. However the standard calculation of Scimago Journal Rank (SJR) uses a 3-year window. As a result, changes in SJR lag changes in Impact Factor a bit. Because these are values derived from 2-3 years of citation behaviour, no single year totally throws off the calculation, but this difference in time window can introduce noise unnecessarily. We prefer to use 2-year Impact Factors and cites/doc values in the preprint as this is the most common form of Impact Factor, and so more intuitive for the reader.
But we can avoid this lag effect if we simply use 3-year windows for Impact Factors or cites/doc. So in the shiny app, we have used Scimago cies/doc (3-years) / SJR to calculate Impact Inflation. These numbers are very similar to the values you get from using a 2-year window for cites/doc, but for journals with big changes to cites/doc over time, the result is a slightly lower volatility in Impact Inflation from year-to-year as a result.
Footnotes
Researchers have a right to web-scrape information and to use it for scientific analyses, but not to further release the raw data scraped. Those data belong to the web-scraped parties (in this case, publishers), who retain rights over their distribution.↩︎